Sites such as Topsters 2 are popular in some online communities to create collages of albums (known as "tastecharts") to share with other users.
Below is an example of one such image.
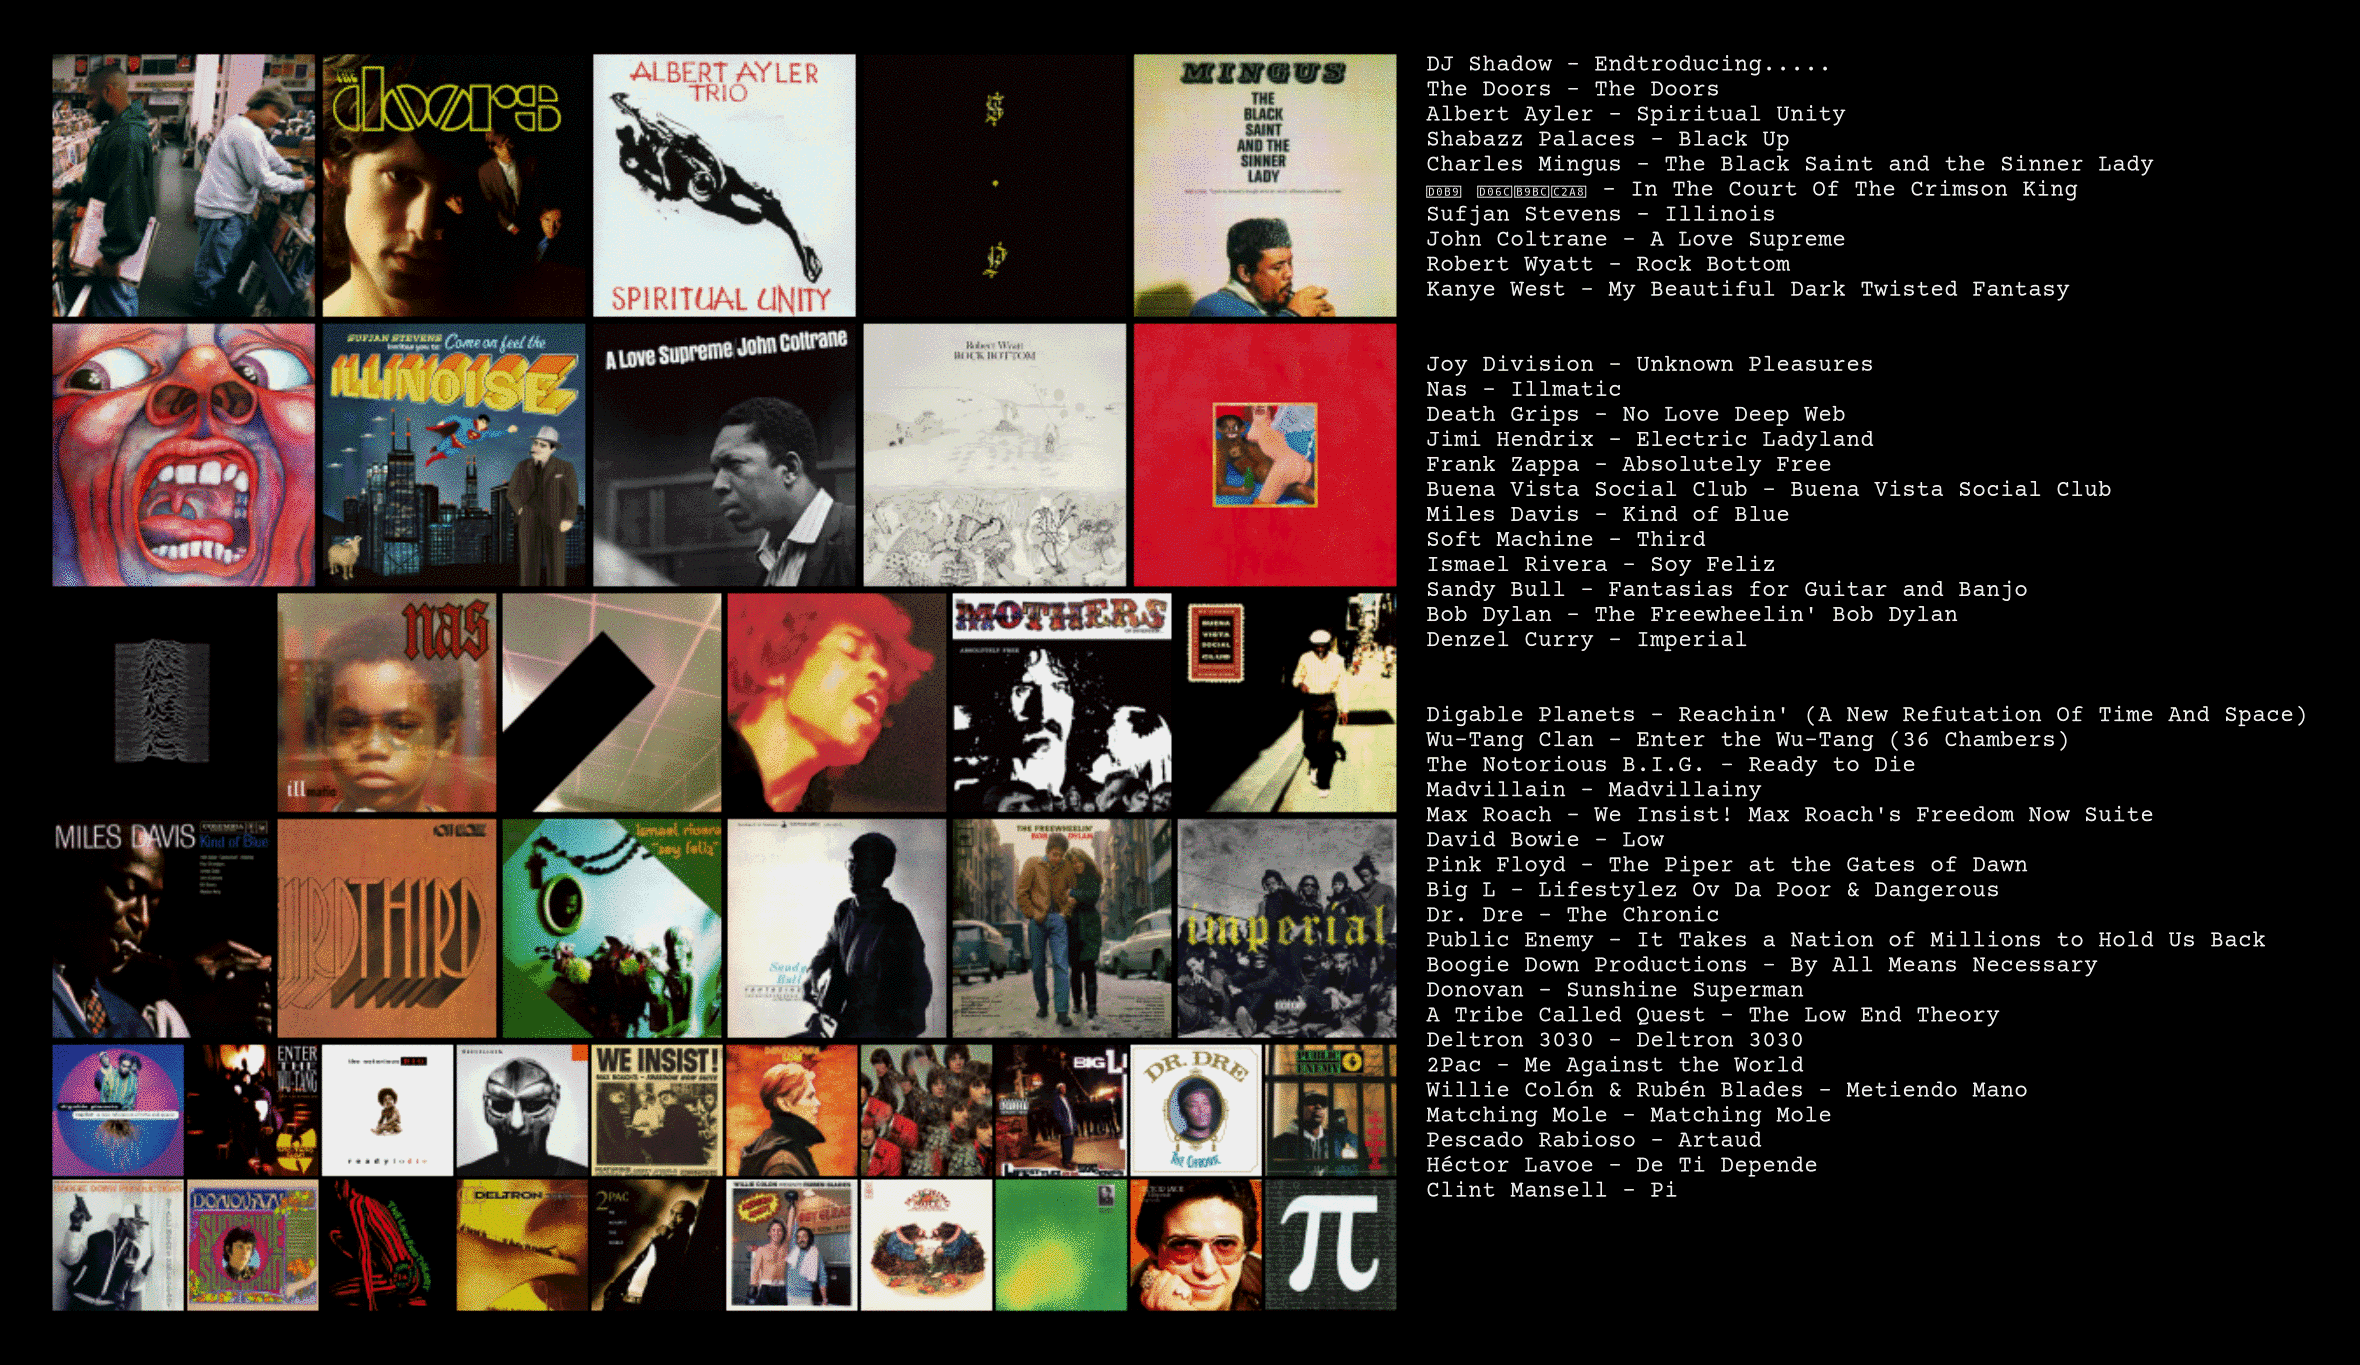
Due to the effort involved in making these images, they are usually thoughtfully constructed and provide a portal into a world of obscure and underrated music. But manually examining each image to determine if the user has listed some albums you already enjoy is tedious. Some users choose to use a template that omits album labels, necessitating a reverse-image search on a manually-cropped cover to even identify some albums.
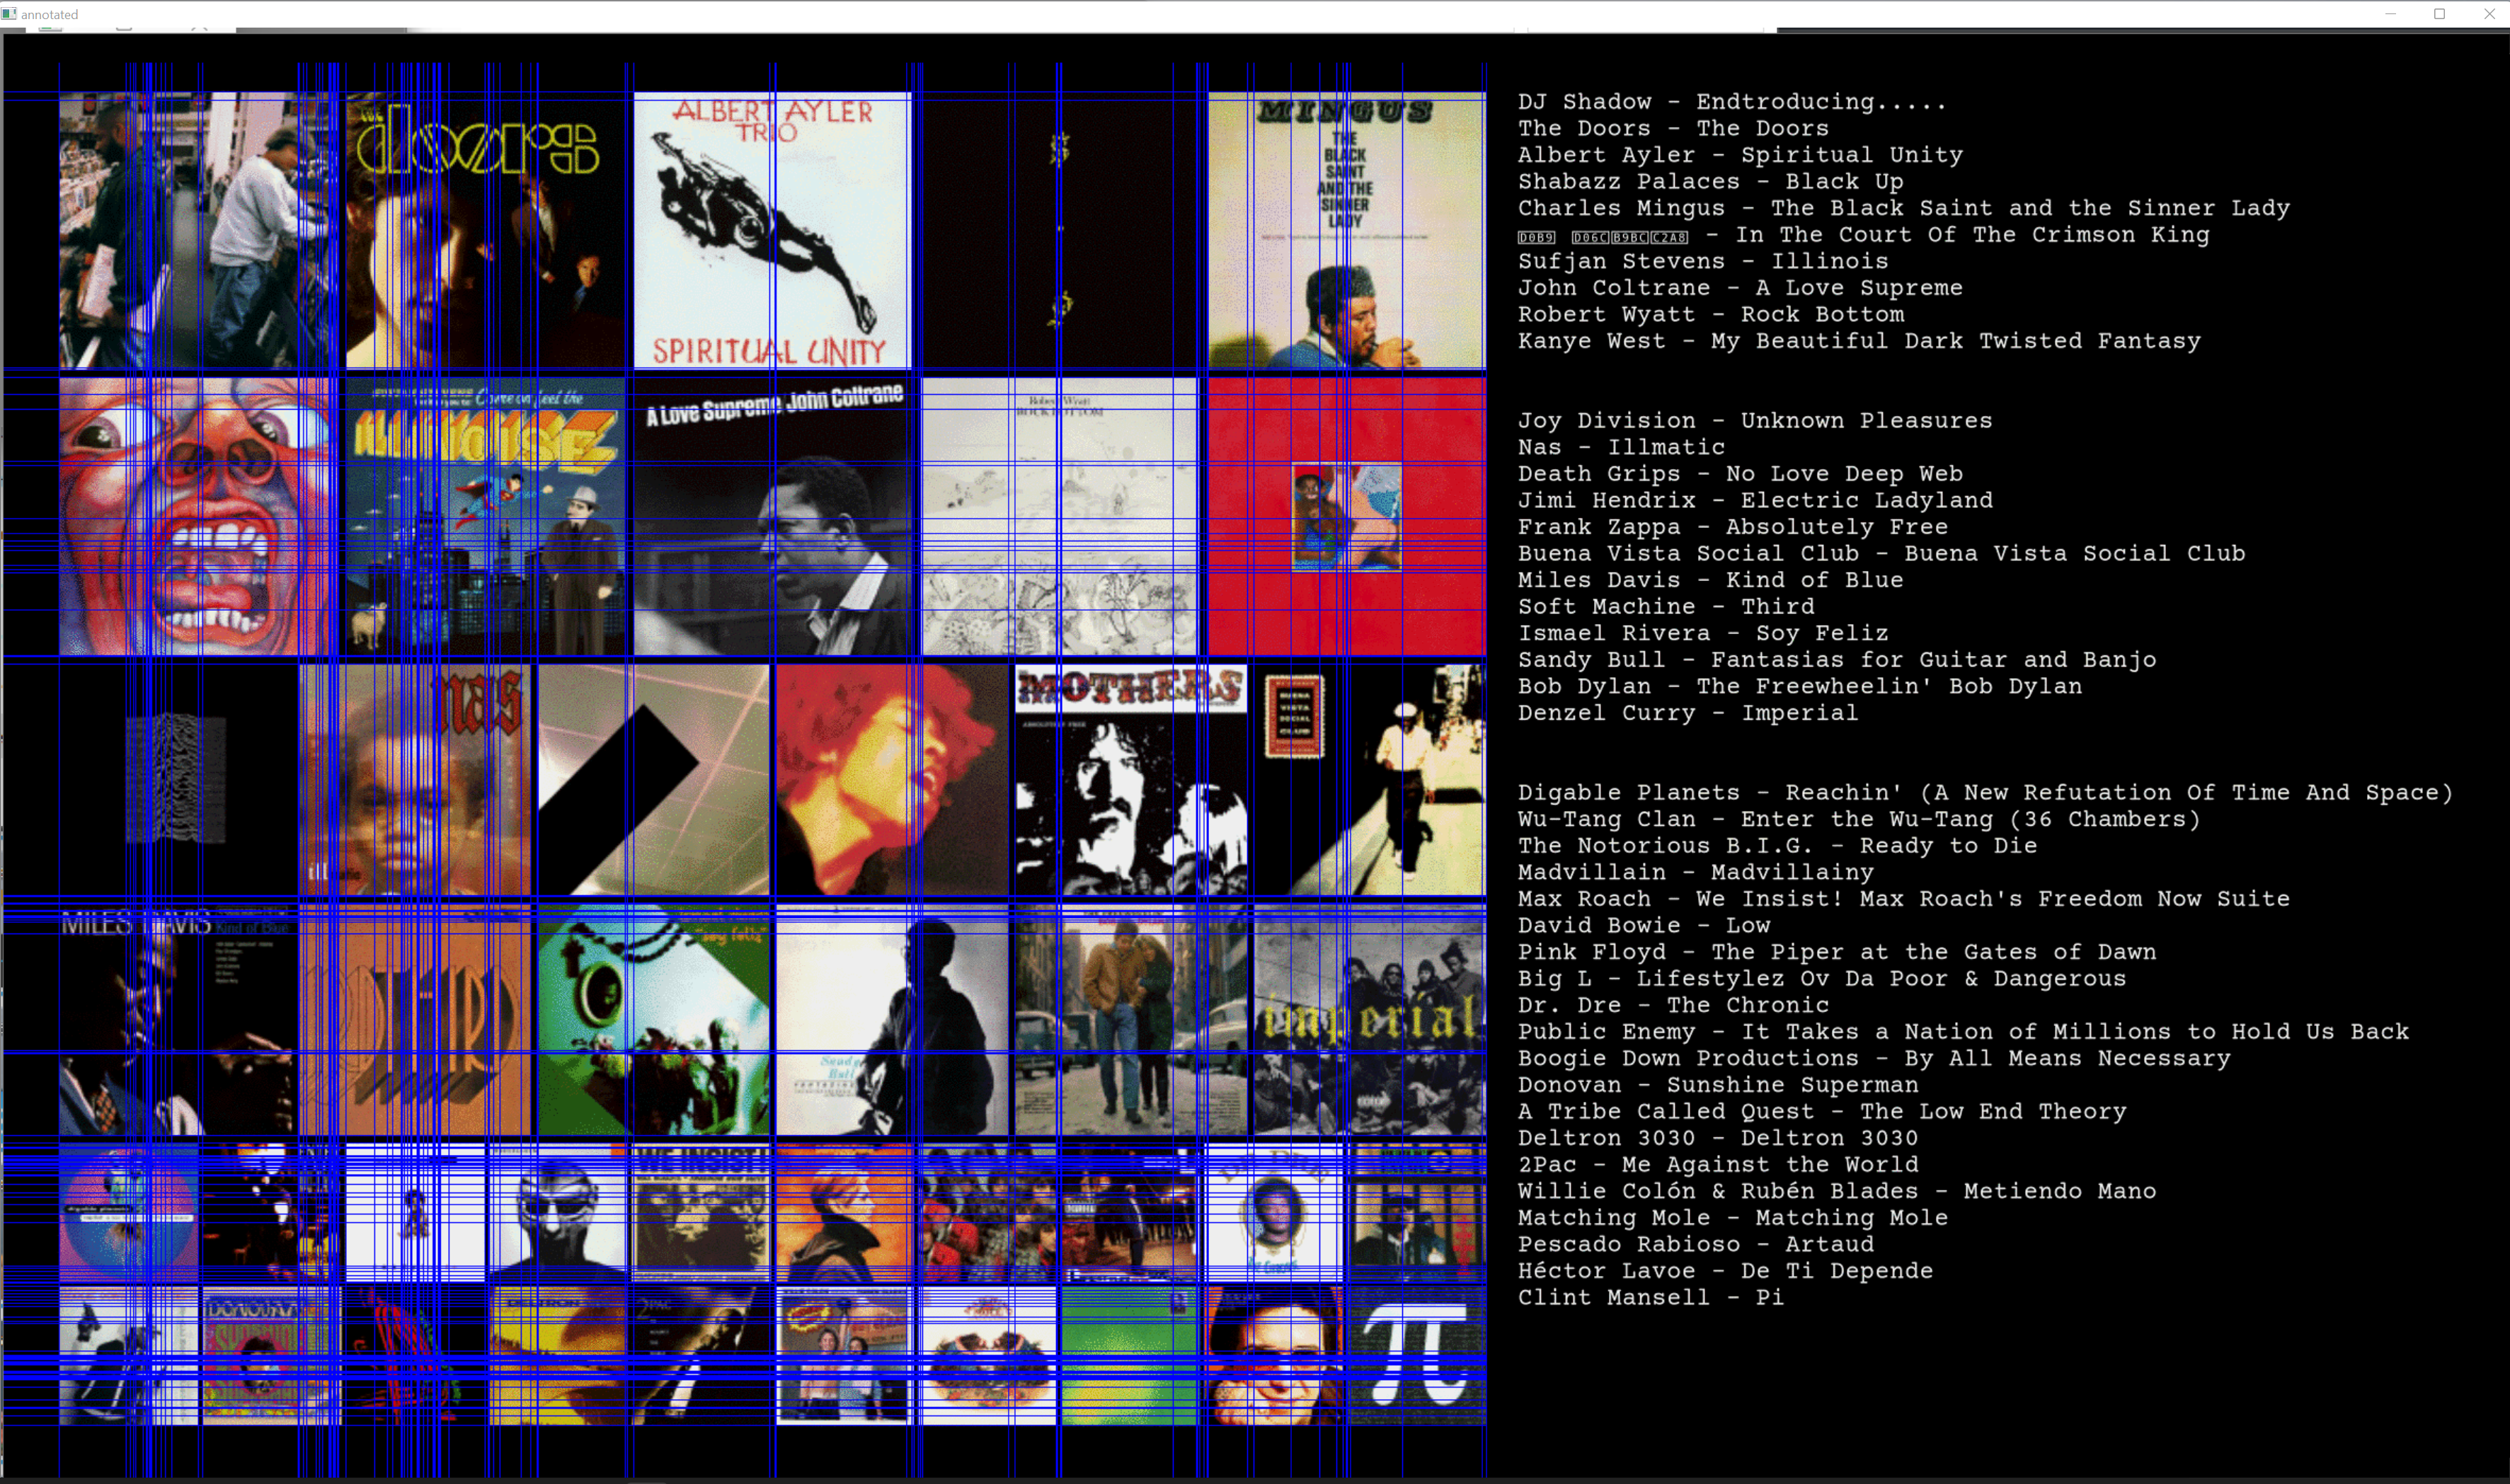
I developed an algorithm in Python using libraries such as OpenCV to identify the grid layout used in creating a tastechart, and extracting each individual album cover. Below is a visualization of part of that process, with blue lines overlaid to represent possible grid alignments.
After processing approximately 14,000 tastecharts, over 725,000 subimages were obtained. Both the blockhash and pHash algorithms were used to hash each image, then subimages with similar hash values were grouped together. Due to the large number of comparisons, the grouping was implemented as a seperate executable in C++ to speed up the process with AVX2. The groups with the most subimages were labeled with album metadata using the Google Knowledge Graph Search API. Finally, the Apple Music API was used to connect albums to their streaming page where available.
Source code is not publically-available at the moment, I plan to reimplement significant portions of this project using more robust computer vision techniques.
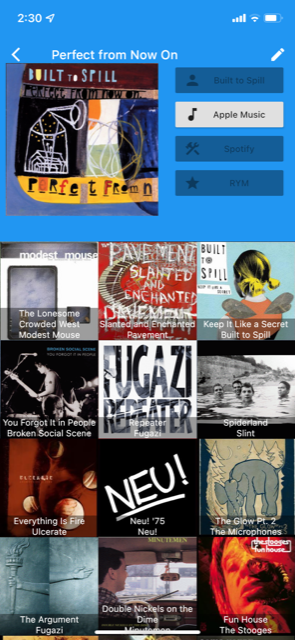
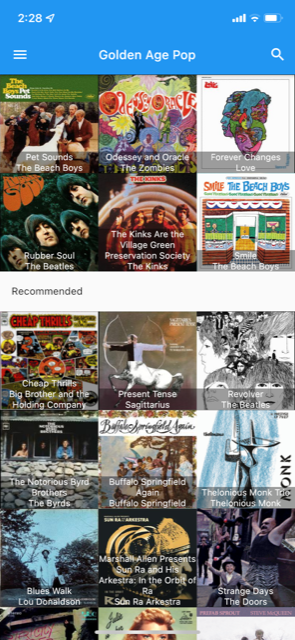
I created a front end in Flutter to interact with the database created using the earlier steps. Navigating to any individual album will recommend other albums that it is similar to. This is based on calculating how likely each pair of albums is to appear on the same user's chart. Lists can also be created to find the albums most similar to an arbitrary group of albums.